
Financial Information
Unaudited Financial Statements Announcement For the half year ended 30 June 2025
Financials Archive
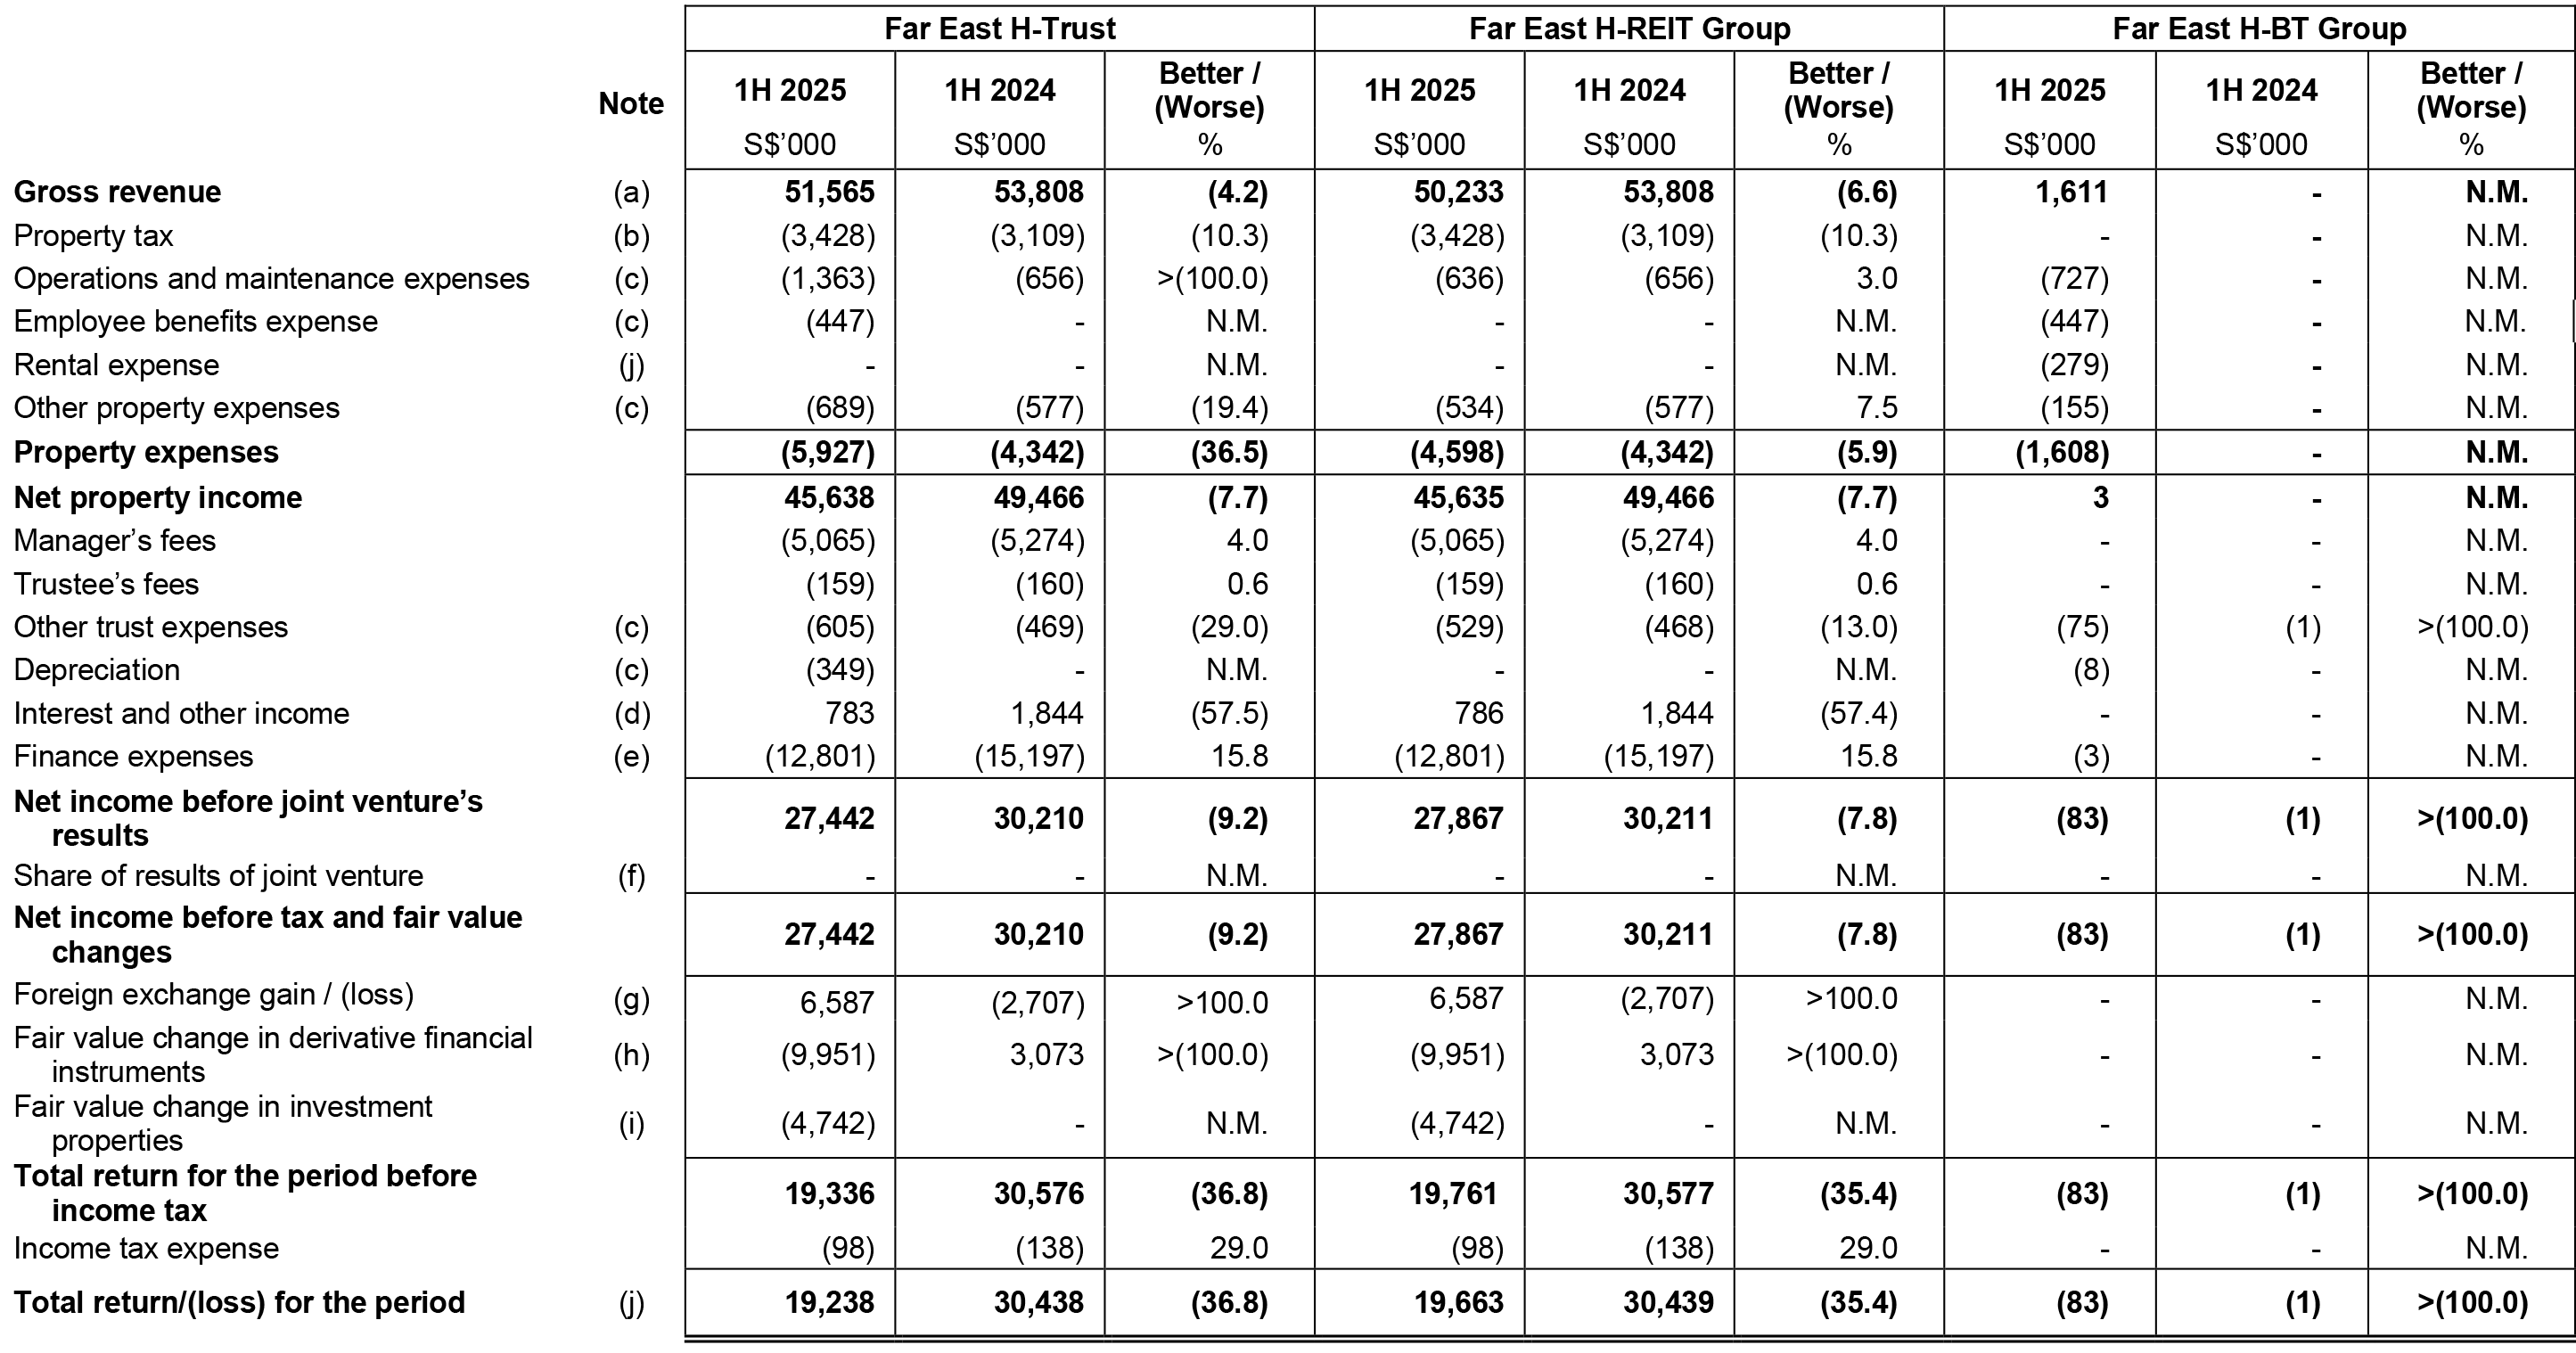
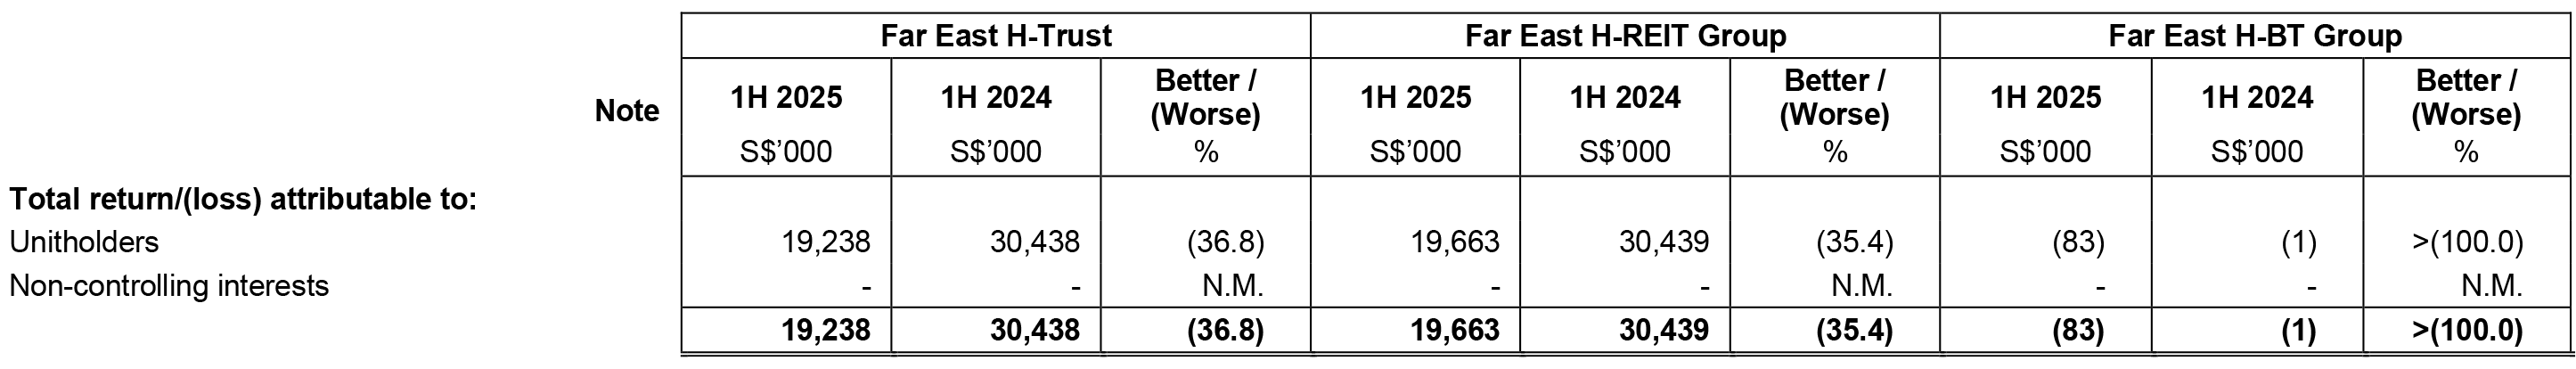
Statements of Total Return, Statements of Other Comprehensive Income and Distribution Statements
Notes:
NM - Not meaningful
- Refer to section 8 on "Review of performance" for the explanation of variances.
- The increase in property tax expense is due to higher annual value assessments by Inland Revenue Authority of Singapore ("IRAS").
- The increase in these expenses is mainly due to the inclusion of hotel operating expenses following the acquisition of FPN which was completed on 25 April 2025. Far East H-Trust's other property expenses for 1H 2025 includes impairment losses on trade receivables of S$18k. (1H 2024: S$40k).
- Lower interest and other income is mainly due to lower interest income from fixed deposits and joint venture.
- Lower finance expenses are mainly due to lower interest rates on the floating rate loans.
- The share of results of joint venture relates to the equity accounting of Fontaine Investment Pte Ltd ("FIPL")'s results. The share of losses has exceeded the carrying amount of the investment since December 2021.
- The foreign exchange gain arose mainly from exchange difference on the US dollar denominated term loan. A cross currency swap ("CCS") has been entered into to hedge against any foreign exchange exposure on the US dollar denominated principal and interest payments. This is a non-tax chargeable / deductible item and has no impact on the taxable income and distributable income to the Stapled Securityholders.
- This relates to net change in fair value of interest rate swap and cross currency swap contracts entered to hedge against the interest rate and foreign currency exposure of Far East H-REIT. This is a non-tax chargeable / deductible item and has no impact on the taxable income and distributable income to the Stapled Securityholders.
- The fair value change in investment properties of S$4.7 million for 1H 2025 arose from the revaluation of Village Residence Hougang as at 30 June 2025. Please refer to Note 1(e)(3) Investment properties for more details. This is a non-tax chargeable / deductible item and has no impact on the taxable income and distributable income to the Stapled Securityholders.
- Far East H-BT Group acts as the master lessee of FPN and the loss is attributable to the master lease rental expense paid to Far East H-REIT Group.
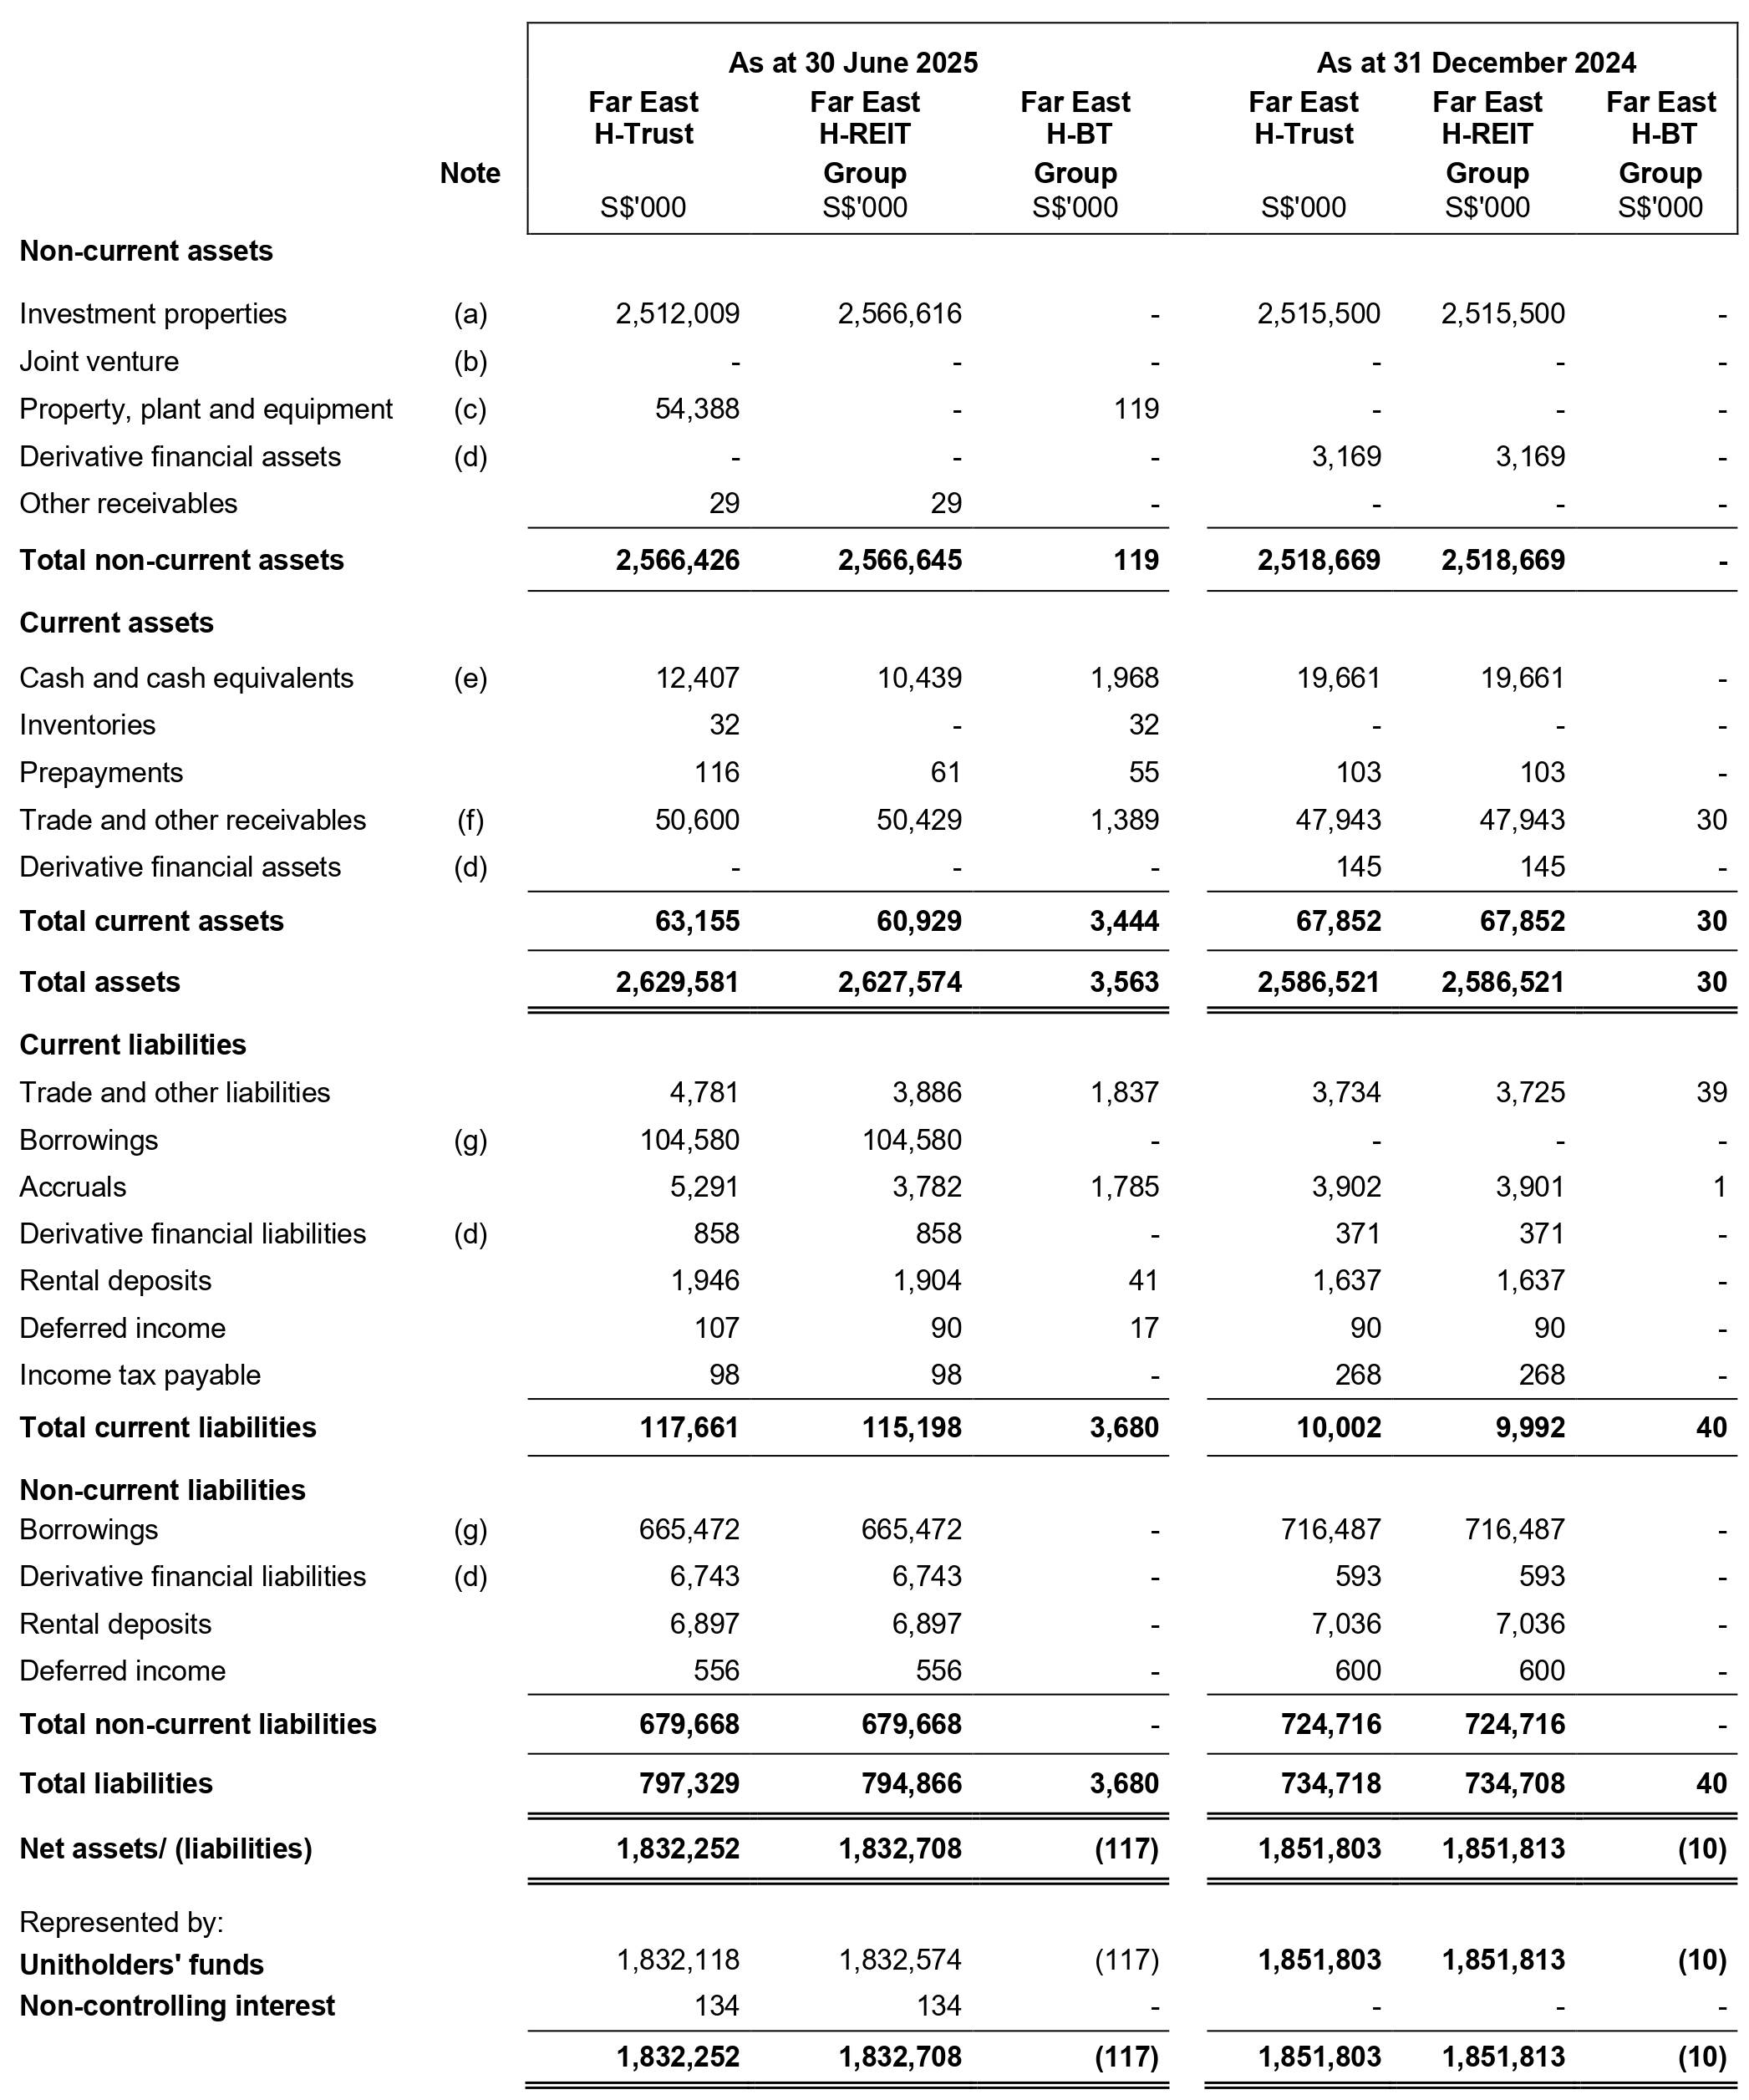
Balance Sheets as at 30 June 2025
Notes:
- The decrease in investment properties at Far East H-Trust was mainly attributable to fair value change in investment properties of S$4.7 million offset by the capital expenditure capitalised for Village Residence Hougang, Oasia Hotel Novena, Village Hotel Bugis, and Rendezvous Hotel Singapore.
For Far East H-REIT group, investment properties pertain to both Singapore and Japan properties. The increase in investment properties was due to the acquisition of FPN on 25 April 2025.
Please refer to the details in Note 1(e)(3) Investment properties. - This relates to the 30% joint venture interest in FIPL, for which the share of losses exceeded the carrying value of investment as at 30 June 2025.
- The increase in property, plant and equipment as at 30 June 2025 relates to acquisition of FPN.
Please refer to the details in Note 1(e)(4) Property, plant and equipment. - This relates to the fair value of interest rate swap and CCS contracts entered to hedge against interest rate risk and foreign exchange exposure of Far East H-REIT.
- Cash and cash equivalents includes fixed deposits of S$5.8 million. The decrease in cash and cash equivalents is mainly due to the payment of distributions.
- This includes a shareholders' loan and accrued interest due from FIPL of S$37.0 million. The amount is used to finance the development of Village Hotel Sentosa, The Outpost Hotel Sentosa and The Barracks Hotel Sentosa which commenced hotel operations in 2019.
- The total gross borrowings as at 30 June 2025 of S$771.7 million was S$53.6 million higher compared to balances as at 31 December 2024 due to the drawdown of term loan facilities of JPY5.9 billion, issuance of JPY0.5 billion TMK bonds and revolving credit facility ("RCF") of JPY364.3 million to fund the acquisition of FPN in April 2025, and partially offset by unrealised foreign exchange gain on the JPY borrowings and US dollar denominated term loan.
As at 30 June 2025, Far East H-REIT has undrawn and uncommitted revolving credit facilities ("RCF") of S$271.8 million with 3 banks to fulfill its liabilities as and when they fall due.
Please refer to the details of aggregate amount of borrowings as disclosed in Note 1(e)(5) Borrowings.
Review of the performance of half year ended 30 June 2025
1H 2025 vs 1H 2024
Gross revenue for 1H 2025 declined 4.2% year-on-year ("YoY") to S$51.6 million, primarily due to softer performance from the Singapore Hotels and Serviced Residences. This was partially mitigated by higher revenue from the Commercial Premises and the maiden contribution from Four Points by Sheraton Nagoya ("FPN") of S$1.6 million, the Trust's first overseas acquisition and a step toward income diversification.
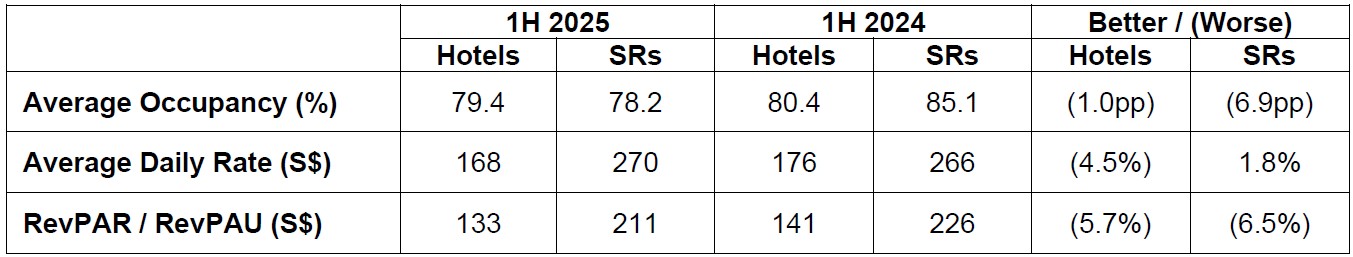
The Singapore Hotels recorded a 4.5% YoY decline in average daily rate ("ADR") to S$168, while average occupancy remained relatively stable at 79.4%. The softer performance was partly due to the absence of large-scale concerts and major events in the first quarter that had boosted demand in the prior year. Rising geopolitical and macroeconomic headwinds have also impacted corporate bookings as well as leisure demand from major markets. Despite these challenges, occupancy was sustained through tactical rate management and efforts to increase direct bookings.
In the Singapore Serviced Residences ("SRs"), average occupancy declined YoY to 78.2%, as the first quarter was weighed down by lift replacement work which was completed in January, as well as softer corporate demand. Occupancy recovered to 82.7% in the second quarter, driven by a shift in guest mix toward more leisure travellers. ADR rose 1.8% YoY to S$270, as the portfolio benefited from higher-rated, shorter-stay bookings amidst cautious sentiment in the uncertain macroeconomic environment that dampened corporate demand.
A snapshot of the performance of the Hotels and SRs in Singapore for 1H 2025 is set out below.
For FPN in Japan, revenue contribution amounted to S$1.6 million for the two months since the acquisition was completed on 25 April 2025. On a like-for-like basis3, RevPAR for May and June rose 0.5% YoY to ¥6,925, while gross operating profit ("GOP") for FPN increased 22.9%, driven mainly by disciplined cost management and improved operational efficiency. Looking ahead, there remains further upside for FPN as arrivals at Chubu Centrair International Airport continue to recover toward pre-pandemic levels.
The commercial premises and other income in the portfolio remained resilient, with revenue rising 6.4% YoY to S$9.2 million. This was driven mainly by improved occupancies and higher rental rates, led by stronger performance of the office units. Leasing activity remained healthy, supported by sustained demand and steady tenant renewals. The increase also included new revenue contribution from the carpark at FPN.
Net property income ("NPI") declined 7.7% YoY to S$45.6 million mainly due to lower gross revenue and higher property-related expenses.
For 1H 2025, distribution to Stapled Securityholders stood at S$36.0 million, comprising S$30.6 million of taxable income and S$5.4 million of other gains. This translates to a total Distribution per Stapled Security ("DPS") of 1.78 cents.
In conjunction with the earn-out stapled securities expected to be issued on 20 August 2025 in relation to the acquisition of Oasia Hotel Downtown, the REIT Manager declared an advance distribution for the period from 1 July 2025 to 19 August 2025, estimated to be 0.47 cents per Stapled Security.
Further to the earlier commitment to share a portion of the gains from the divestment of Central Square, the REIT Manager will be distributing a further and final S$2.5 million of other gains in the second half, bringing it to a total of S$8.0 million for this year.
Commentary on the competitive conditions of the industry in which the group operates and any known factors or events that may affect the group in the next reporting period and the next 12 months.
In Singapore, the hospitality industry continues to be supported by major MICE and leisure events, including the World Aquatics Championships scheduled in July and the Formula 1 Singapore Grand Prix in October. Opening of new attractions in 2025 will help to further strengthen Singapore's tourism appeal. These include Minion Land at Universal Studios Singapore, Singapore Oceanarium at Resorts World Sentosa, and Rainforest Wild Asia at Mandai Wildlife Reserve.
While the outlook remains broadly positive, the pace of tourism recovery may be tempered by external headwinds such as global economic uncertainties, geopolitical tensions, and the strong Singapore Dollar, which could impact travel sentiment and discretionary spending.
In Japan, visitor arrivals reached 21.5 million in 1H 2025, a 21% increase from the same period last year and exceeding pre-pandemic levels and remains on track to surpass 40 million arrivals in 2025, supported by continued tourism promotion and major events such as Expo 2025 in Osaka.
The REIT Manager remains focused optimising the performance of the portfolio amidst ongoing macroeconomic uncertainty. The easing interest rate environment is expected to lower financing costs and enhance funding flexibility. As one of the lowest geared S-REIT, Far East H-Trust has significant headroom to pursue yield-accretive acquisitions.
